Business applications · Germany
Enterprise Analytics Platform
Sevendyne built a remote analytics engineering team for a German restaurant-data client, then that team worked with their operators to design and ship decision-grade dashboards — moving from prototype exports to a platform they could trust month after month.
3-minute CTO brief
We staffed a dedicated analytics pod for the German client and plugged them into the client’s operating cadence — standups with business owners, PR reviews with their tech leads, and paired reviews on ETL correctness. Restaurant and operations data lived in silos — exports, not a platform. The team split concerns: Python owns ingestion and heavy SQL, Spring Boot serves governed APIs, Angular + eCharts owns operator dashboards. Each layer scales and deploys independently.
- Complexity: ETL correctness, query performance, UX for operators
- Anti-pattern avoided: One giant PHP monolith report page
- Since 2024: Production dashboards, not slide-ware
Data platform · ETL · governed APIs
Pipeline architecture
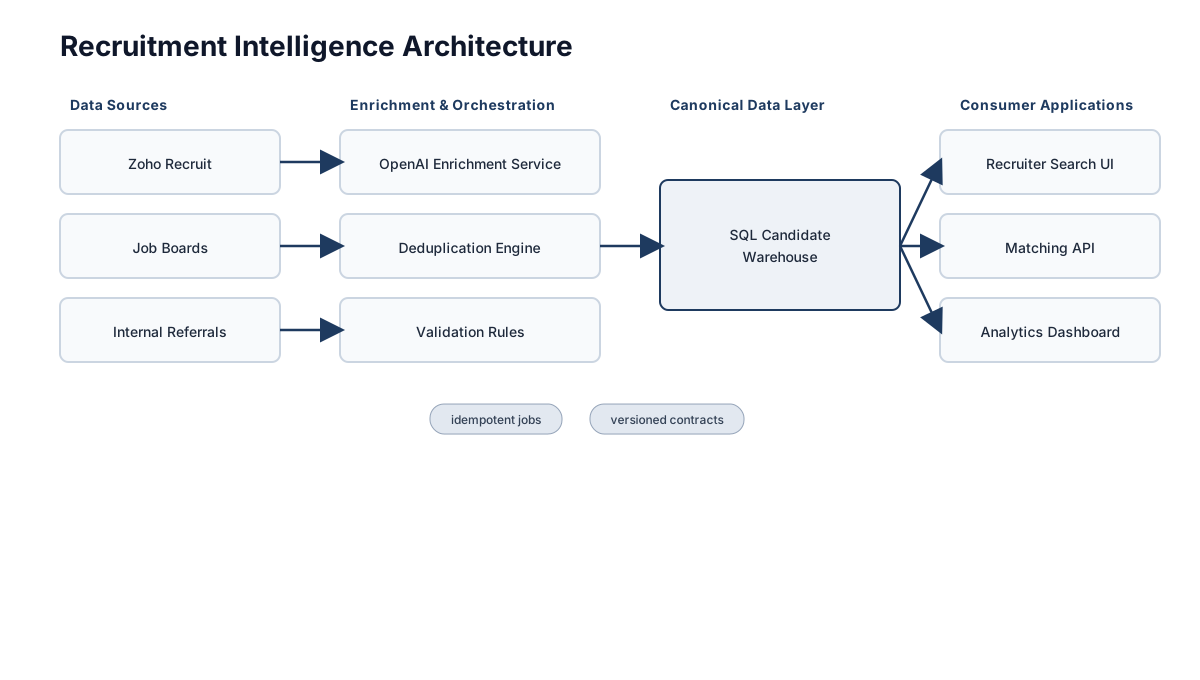
Sources (POS, finance exports, third-party feeds) land in a staging schema via Python jobs. Spring services expose versioned REST aggregates; Angular apps consume stable DTOs — chart configs stored as data, not hard-coded in templates.
Why Spring + Angular + Python (not one stack)
| Layer | Role | Why separate |
|---|---|---|
| Python jobs | Ingest, cleanse, complex SQL | Fast iteration on messy source files; rich data libs. |
| Spring Boot | Auth, APIs, business rules | Typed contracts for EU ops; cacheable aggregates. |
| Angular + eCharts | Operator UI | Drill-down dashboards; chart reuse across business units. |
Reliability & scale tactics
- Idempotent nightly batches keyed by
source_batch_id— safe reruns after failure. - Materialized summary tables for dashboard queries — sub-second loads on million-row facts.
- Feature flags on new metrics — operators opt in per region before default-on.
Production outcomes
- Operations teams use dashboards daily for staffing and margin decisions.
- Governed API layer replaced ad-hoc spreadsheet exports.
- Pipeline extensions ship without rewriting front-end chart code.